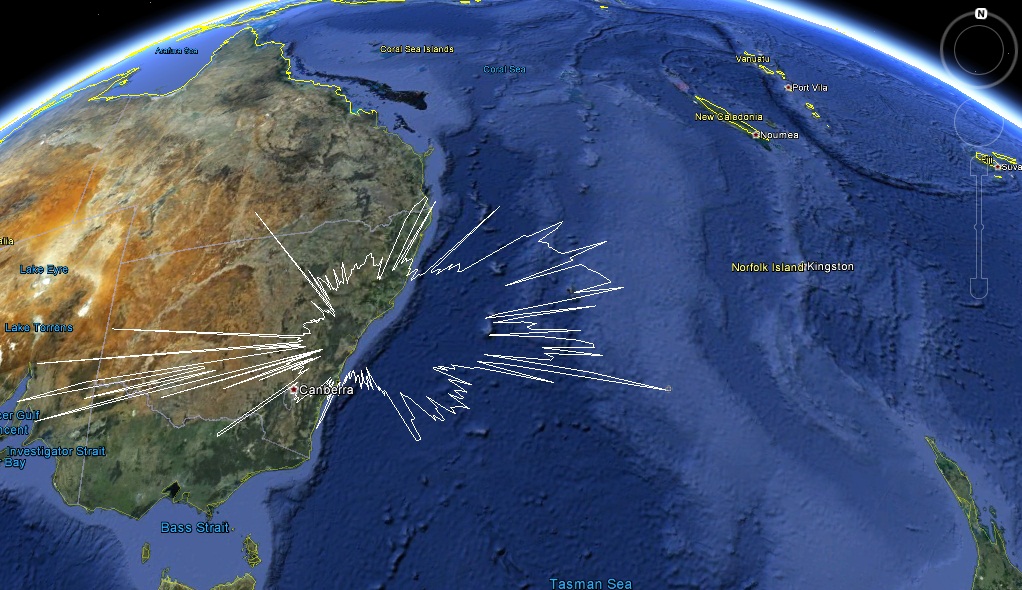
As the AriNav System polar plot is restricted to 300nm, my son wrote a Google based App where you can select the range you want. When I entend the
range out to 700nm, my polar plot looks like this. There is a definite straight line across the northeast, where the Brisbane-Auckland flights are being
tracked.
Also interesting was the number of transmissions received since I setup the AirNav Systems RadarBox in March this year. My RadarBox has received
1,144,729,694 (1.1 Billion) transmissions, that's an average of 64 per second over this period. I have seen peaks of around 450 transmissions per second.